

Data analytics and reporting
Enable smarter decisions with real-time analytics and intuitive visualizations.

Challenge to solution:Govern enterprise dataflows
Challenge
Solution
Challenge
Struggling to consolidate KPIs across disparate data systems?

Solution
Centralized, real-time dashboards connecting operational and analytical data sources
Challenge
Facing delays in identifying performance trends and anomalies?
Solution
Plan and deploy live analytics pipelines to surface insights at the speed of business
Challenge
Finding it hard to align analytics tools with your evolving data architecture?
Solution
Modern BI platforms with hybrid and multi-cloud data environments seamlessly
Challenge
Unable to tailor reports to business specific needs and roles?
Solution
Custom reporting frameworks that adapt to user roles, KPIs, and regulatory demands
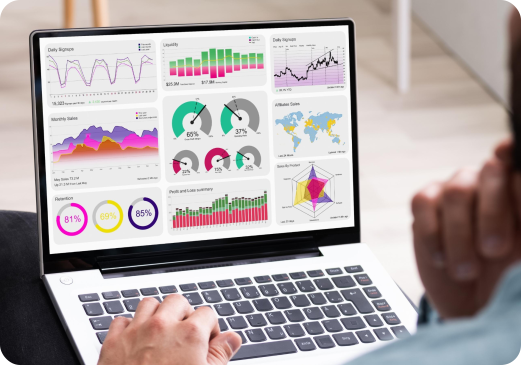
Dashboard and KPI visualization
Deliver operational and strategic clarity through real-time visual insights.

What we do:
- Build dashboards with custom KPIs
- Feed real-time data to visual layers
- Add drilldowns for role-based views
Business impact:
- Faster insight for daily decisions
- Shared views improve transparency
- Teams use data more consistently
Business Intelligence (BI) integration
Empower analytics through unified business intelligence ecosystems.
What we do:
- Connect BI to cloud data platforms
- Tune queries for speed and scale
- Standardize access with models
Business impact:
- BI use grows across all teams
- Data stays unified, not siloed
- Hands-on, timely, and clear insights


Want to improve KPI visibility by 3x with live dashboards?
Custom reporting
On-hand and real-time insights aligned to dynamic business priorities.
What we do:
- Configure reports by role or KPI
- Schedule, trigger, or run on demand
- Add checks for data compliance
Business impact:
- Reports reflect real business need
- Faster response to new priorities
- Stay aligned with policy rules

Real-time business insights streaming
Harness live data flows to drive instant operational intelligence.
What we do:
- Set up streams for live KPIs
- Link dashboards to active data
- Alert based on set thresholds
Business impact:
- Teams act on events instantly
- Smarter/faster moves give market edge
- Lower incident response times

Data pipeline & transformation
Build scalable data flows and transformation layers for clean analytics
What we do:
- Design pipelines for automated data ingestion and cleaning
- Apply enrichment and modeling transformations efficiently
- Ensure data lineage and quality verification steps
Business impact:
- Faster access to trusted data sources
- Reduced manual intervention in processing
- Enhanced agility for data-driven decisions

Time-series intelligence
Build scalable data flows and transformation layers for clean analytics
What we do:
- Capture and analyze time-indexed data streams
- Detect anomalies and trends through ML models
- Provide real-time dashboards and predictive alerts
Business impact:
- Improved visibility into operational trends
- Proactive issue detection and resolution
- Informed decisions backed by live insights