

How real-time observability transformed ERP performance diagnostics
Client: Mid-sized SaaS provider (North America) | Solution: Real-time monitoring framework with dynamic architecture discovery
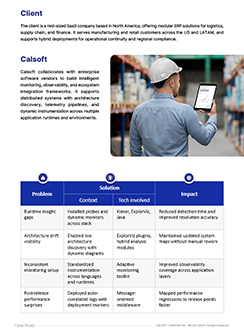
Blind spots slowed incident response
The ERP platform lacked visibility into service transactions and dependencies. Teams couldn't trace failures across cloud and on-prem modules. Manual instrumentation delayed coverage. Performance issues emerged without clear links to recent deployments.
Solution
Calsoft built a live observability framework that captured telemetry without code changes, mapped service flows in real time, and tagged metrics with release data.
- Deploy non-intrusive probes across all runtimes
- Generate dynamic maps of service dependencies
- Correlate logs and traces in unified views
- Link performance shifts to specific builds
The system provided historical snapshots and failure propagation paths, enabling targeted diagnostics across hybrid environments.
Business Value


To Know More
About how we can align our expertise to your requirements, reach out to us.