

Scattered data delays decisions. A KPI dashboard fixes that: one view, critical metrics, no guesswork. Understanding the role of KPIs in retail strategy means recognizing how key performance indicators or quantifiable measures help retailers track progress toward specific goals that support both short-term actions and long-term growth in retail businesses.
|
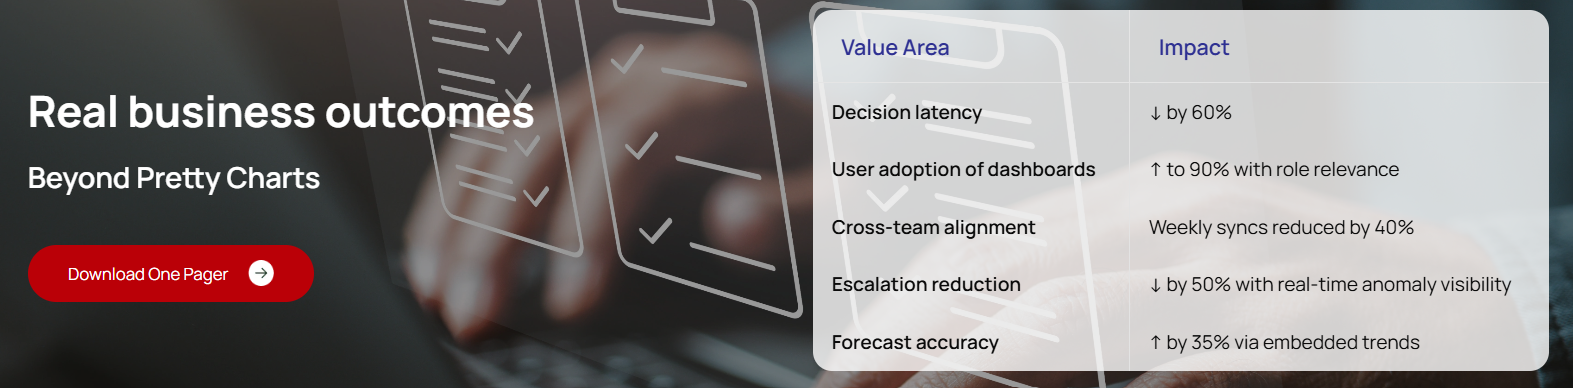
Most retail dashboards fail before they’re even opened. They’re built by data teams for data teams, cluttered with n+ metrics, zero hierarchy, and no connection to strategic decisions. Here’s how to fix that. |
|
$7.8B Retail analytics market projected by 2032 |
85% Outperformance by companies using customer analytics |
3x Faster decisions, tracking 15–20 focused KPIs vs. everything |
Continue reading to explore how retail analytics dashboards help teams track the right KPIs, improve decision-making, and build a more connected view of business performance.
The problem: data richness without decision clarity
Retail operations generate data from Point of Sales (POS) systems, e-commerce platforms, CRMs, loyalty programs, and supply chains simultaneously. The volume is not the problem. The problem is that most organizations confuse data access with analytical clarity.
Collecting data is only the first step; real value comes when you act on it. That's where key performance indicators (KPIs) and dashboards come into play.
Whether it’s managing stock, enhancing customer experience, or expanding profit margins, the key lies in how well you measure.
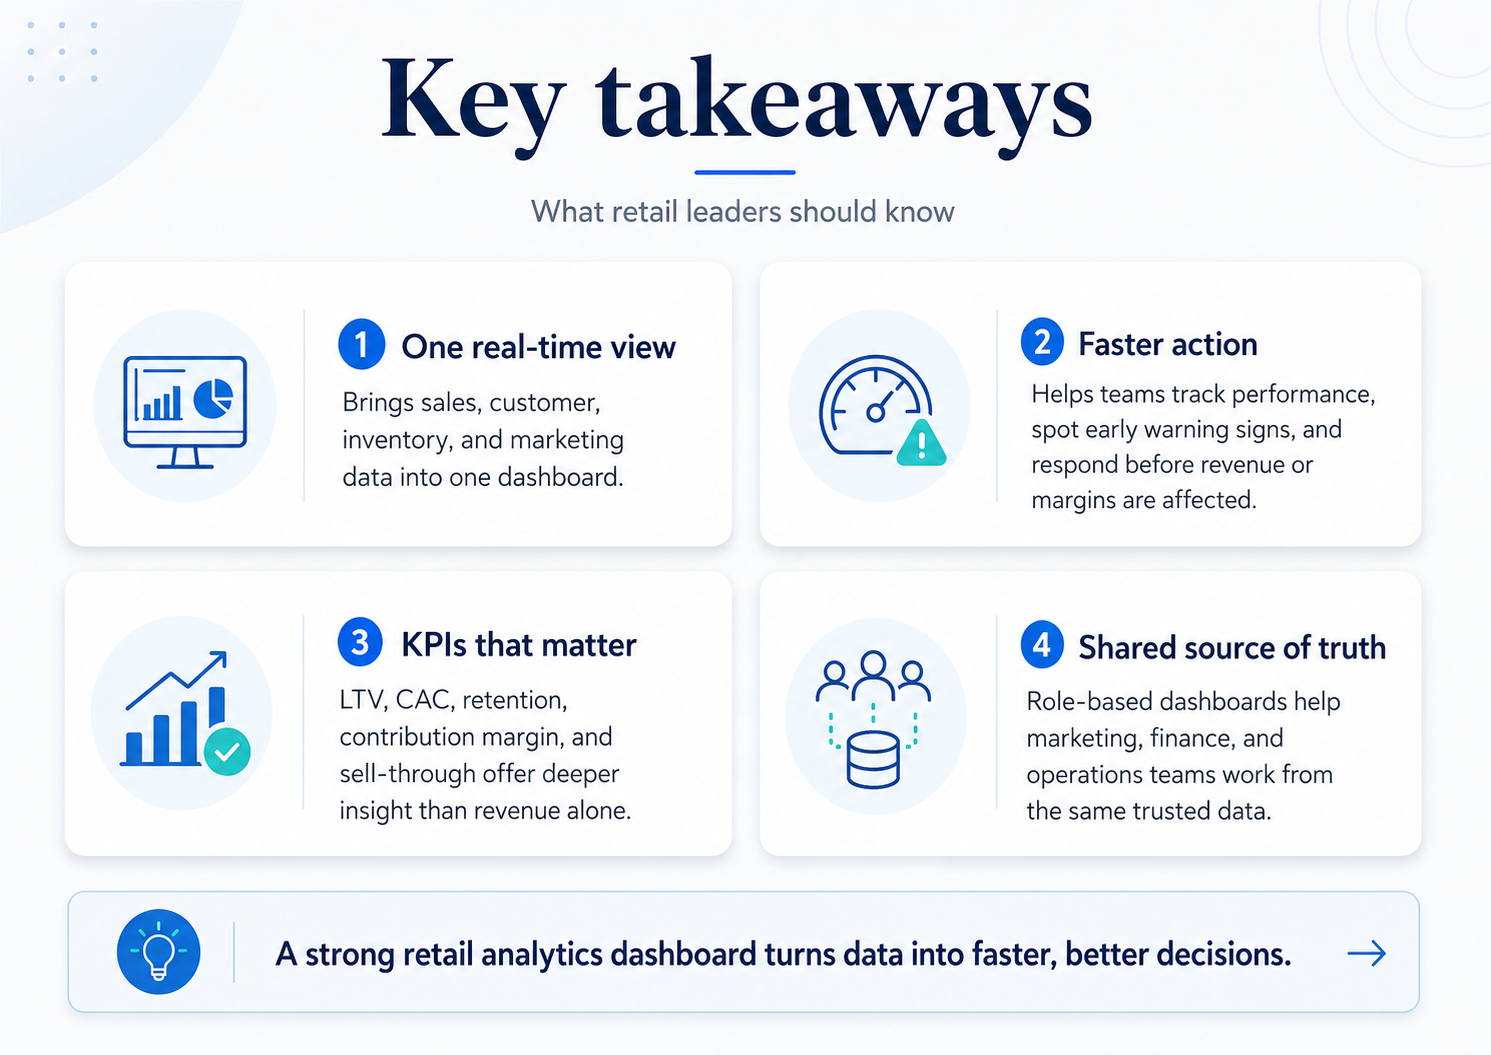
Currently, retailers are dealing with pressure from multiple directions. Store traffic is becoming harder to predict, digital customer acquisition is getting more expensive, supply chains remain uncertain, and consumer behaviour is changing faster than traditional planning cycles can respond. This is why KPI dashboards are no longer just reporting tools. They now act as an operational nerve center, helping leaders spot the right signals early, make faster decisions, and respond with the right action at the right time.
|
The executive dashboard test: If your decision makers can’t answer “Are we on track, and where do we need to act?” within 60 seconds of opening your dashboard, the visualization has failed, not the data. |
Calsoft helps enterprises build real-time KPI dashboards that turn scattered data into clear, role-based business insights. With expertise in dashboard and KPI visualization, BI platforms, cloud-native analytics, and custom dashboard development, Calsoft enables teams to track performance, reduce decision delays, and act faster on business-critical metrics.
The 4 KPI categories every retail dashboard must cover
A complete business view comes from tracking KPIs across critical areas. A balanced KPI framework provides a 360-degree view of performance, helping teams identify gaps, act faster, and make informed decisions.
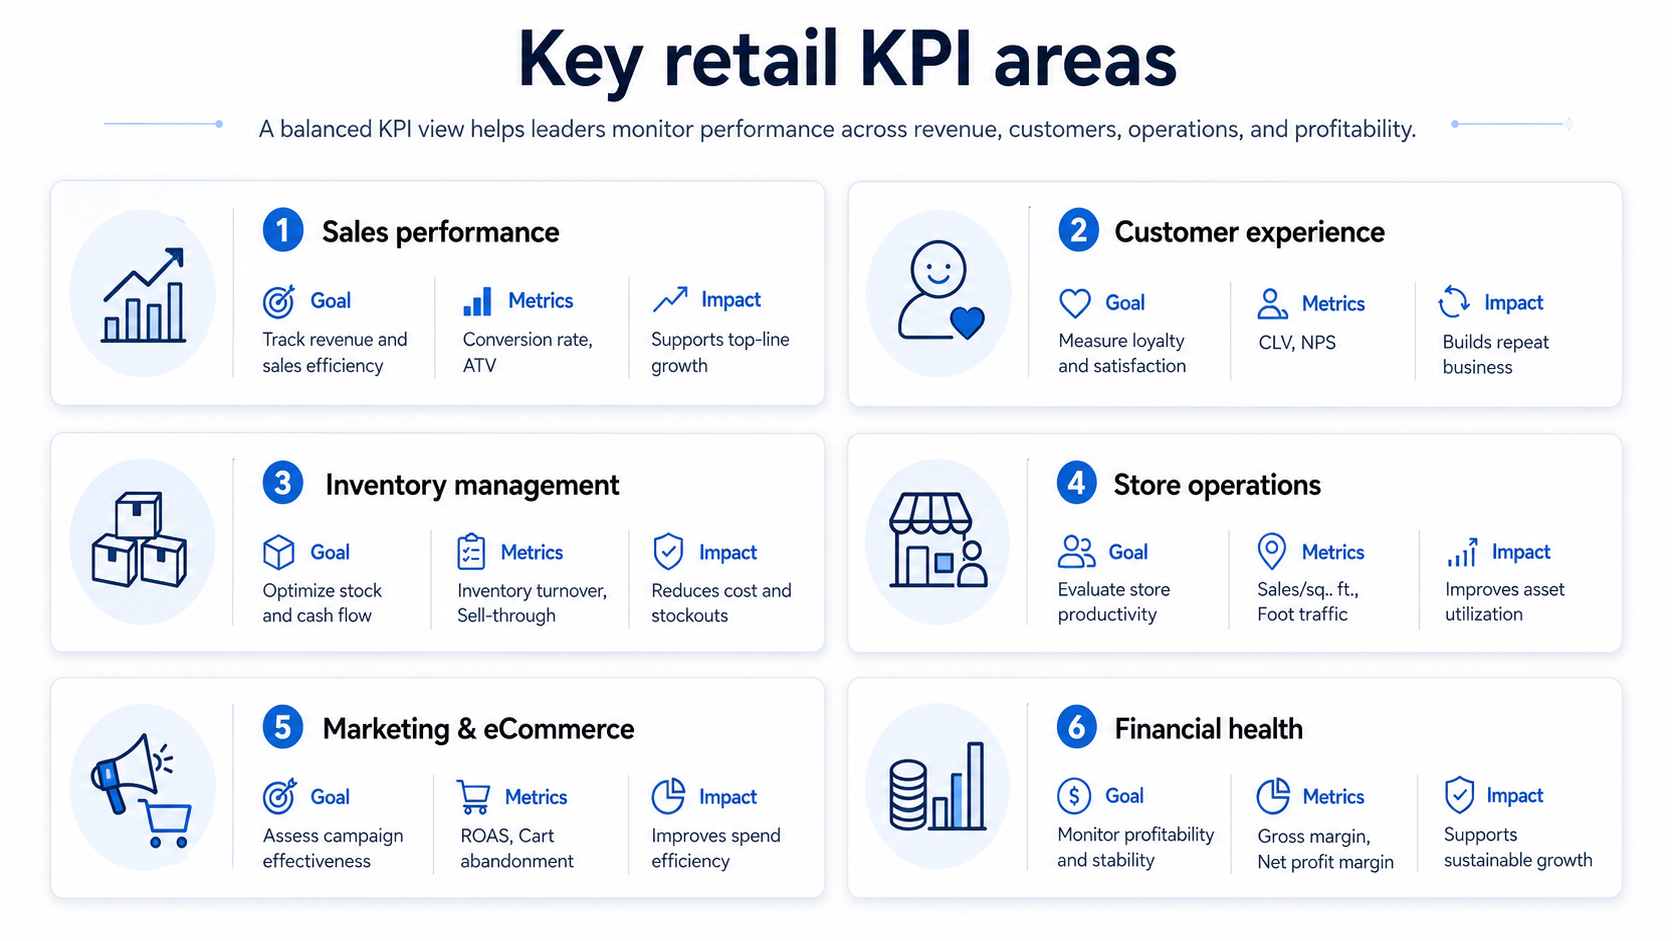
The CLV: CAC ratio should be one of the first metrics retail leaders look at. If it drops below 2:1, the business may be spending more to acquire customers than it can recover through long-term value. Before planning any growth initiatives, leaders need this ratio to be clearly visible on the dashboard as a core indicator of business sustainability
Note: Customer Lifetime Value (CLV), Customer Acquisition Cost (CAC), Net Promoter Score (NPS), Average Transaction Value (ATV), Return on Ad Spend (ROAS)
Dashboard visualization: design principles that drive action
A good dashboard should make the next action clear. If leaders must spend time interpreting the view, important signals can get missed. The goal is to show the right KPIs, with the right context, for the right audience.
- Keep each view focused: Limit dashboards to 6–8 key KPIs. Use drilldowns for deeper analysis.
- Add context to every number: Show current performance against targets, previous year, or benchmarks.
- Use smart alerts: Highlight issues automatically when key metrics cross risk thresholds.
- Balance leading and lagging indicators: Revenue and margin show what happened. Cart abandonment, engagement, and conversion trends show what may happen next.
- Create role-based views: Store managers, CFOs, and marketing teams need different dashboards. One view cannot serve everyone well.
Common retail KPI dashboard mistakes to avoid
|
Mistake |
Business impact |
Better approach |
|
Tracking too many metrics |
Slows decisions and creates confusion |
Focus on the KPIs that drive the most important decisions |
|
Using only lagging indicators |
Problems appear after the damage is done |
Pair outcome metrics with early warning signals |
|
Working with data silos |
Creates conflicting numbers and weak trust |
Build a unified data layer with automated refreshes |
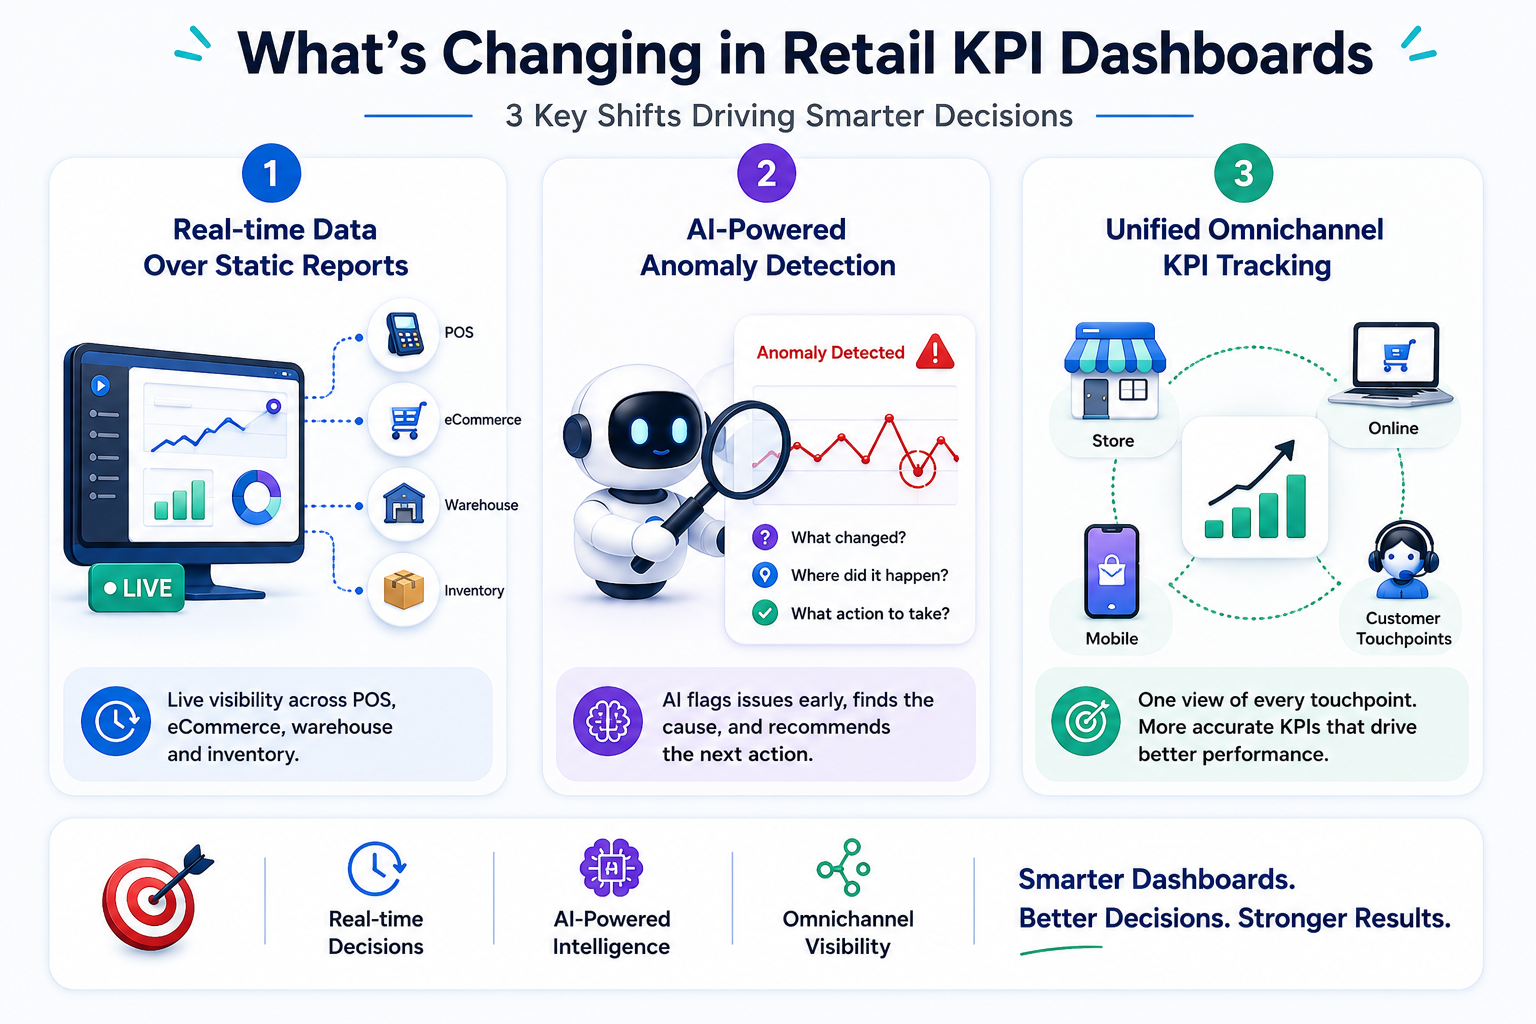
What’s changing in 2026: AI-powered retail KPI dashboards
Retail KPI dashboards are moving from static reporting to real-time decision systems. In 2026, senior leaders need dashboards that connect data across POS, eCommerce, inventory, and customer touchpoints to show what is happening now.
AI is also changing how retailers use dashboard data. Instead of waiting for teams to find performance drops manually, AI-powered dashboards can flag anomalies, identify possible causes, and suggest the next action.

The biggest shift is omnichannel visibility. Store and online data can no longer sit separately. Metrics such as CLV, retention, sell-through, conversion rate, and customer behaviour become more useful when every touchpoint feeds into one unified retail analytics view.
In a nutshell
Retail success today depends on how quickly leaders can turn data into action. A KPI dashboard is a business analytics system that helps teams track performance, spot risks early, and make faster decisions.
The real advantage comes from building dashboards that are clear, role-based, and focused on the metrics that matter most. When sales, inventory, customer, marketing, and financial KPIs are visualized in the right way, retailers can move from delayed reporting to proactive decision-making.
A strong retail KPI dashboard does more than show numbers. It helps leaders see what is changing, understand why it matters, and decide what to do next.
FAQs
What is a retail KPI dashboard?
A retail KPI dashboard is a visual tool that tracks key metrics across sales, inventory, customers, marketing, and finance in one place.
Why are KPI dashboards important for retail analytics?
They help retailers monitor performance, identify issues early, and make faster decisions based on real-time business data.
What KPIs should a retail dashboard include?
A retail dashboard should include KPIs such as sales conversion, CLV, CAC, inventory turnover, sell-through rate, gross margin, and net profit margin.