

Developed by Google, Golang (or Go) is an intriguing programming language that is not only fast but also simple and powerful. Known for its clean syntax, built-in features, and concurrency model, Go fosters readability and maintainability while enabling effective development.
Designed from the ground up, Go was created to be a lean, compiled language capable of handling massive multithreading, concurrency, and performance under heavy workloads. Originally developed for networking and IT infrastructure, Go was envisioned as a replacement for high-performance languages like Java and C++. Today, it is used across diverse applications.
Focused on agility, minimalism, and reliability, Go is a programming language worth exploring. This blog provides an insightful overview of memory management in Golang—its significance, mechanisms, memory allocation, garbage collection, stack handling, and debugging techniques. Perfect for both beginners and experienced developers, it offers practical insights into optimizing memory usage and debugging issues in Go programs.
Why Golang?
Created by Google, Go is a popular language known for simplicity and high performance. It is widely used in cloud and systems programming, game server development, and text processing. Companies like Google, Dropbox, Docker, Cloudflare, and BBC rely on Go, demonstrating its reliability and efficiency.
Go is easy to learn, compile, deploy, and run—making it a favorite among developers. Designed for cloud computing, it includes built-in testing support and cross-compilation capabilities. Its efficient garbage collector simplifies memory management and ensures smooth, optimized performance.
Overview of Memory Management in Go
When programs execute, they allocate memory for objects and release it when no longer needed—this process is called memory management. Go provides automatic memory management, including memory allocation and garbage collection, helping prevent memory leaks and dangling references.
In Go, a memory block is a continuous segment of memory that can host multiple values like structs, arrays, or slices.
When is Memory Allocated in Golang?
Memory allocation in Go primarily occurs using new and make functions. Functional parameters and local variables are usually allocated on the stack for quick access and automatic cleanup. However, dynamic allocations use new or make:
- new: Allocates a single memory block and returns a pointer to a zeroed memory value, typically used for structs.
- make: Creates and initializes slices, maps, and channels. Unlike
new, it returns an initialized value. For instance, slices created withmakecan grow dynamically viaappend().
Understanding how new and make work helps optimize performance and memory efficiency in Go programs.
Where is Memory Allocated?
Go allocates memory on either the stack or the heap depending on how the data is used:
- Memory created with
newcan reside on either the stack or heap. - Memory created with
makeis always on the heap.
Go uses the OS function mmap, similar to TCMalloc (Thread-Caching Malloc), for heap allocation—efficiently managing large and dynamic memory blocks. Each goroutine maintains its own lightweight stack, typically up to 1GB on 64-bit systems (250MB on 32-bit systems), adjustable using SetMaxStack.
To analyze memory allocation, developers can use flags like -gcflags -m to determine how and where memory is allocated, including heap allocations for package-level variables and implicit global pointers.
When is Memory Collected?
- Package-level allocated memory is never collected.
- Goroutine stack memory is automatically released upon exit.
- The garbage collector (GC) collects heap memory that is no longer referenced (i.e., unused memory blocks).
Note: Go uses Stack() to obtain goroutine stack traces for debugging.
How Does the Compiler Detect Unused Memory?
Go’s garbage collection occurs in two phases — Mark and Sweep. It uses a tri-color algorithm to track memory usage:
- Objects are marked as grey and analyzed.
- Referenced (active) objects become black.
- Unreferenced (white) objects are collected.
Garbage Collector
The GC maintains a table for all allocated memory with reference counts. When a reference count reaches zero, the object is marked for collection. Black objects have no pointers to white objects, while grey objects may still reference unprocessed white ones. The GC collects all white-set objects during cleanup.
The garbage collector triggers when a threshold defined by the environment variable GOGC is met. You can adjust it using SetGCPercent() from the runtime/debug package. The default value is 100; setting it to a negative number disables GC. You can fetch GC statistics using GetGCStats().
When Does a Variable Escape to the Heap?
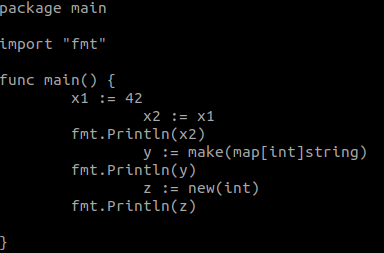
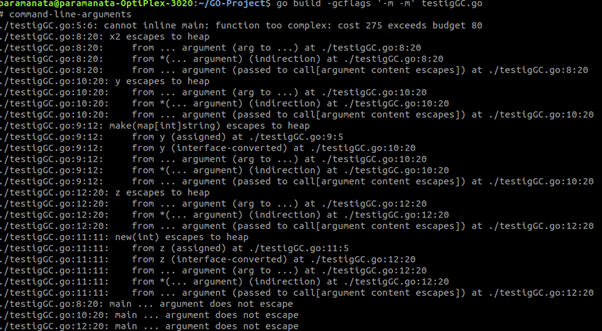
“Escapes to the heap” means the variable is dynamically allocated at runtime because it’s passed to a function whose argument itself escapes to the heap.
x1 remains on the stack, while x2 escapes to the heap when passed to such a function.
Common reasons variables escape to the heap:
- Passing pointers or values to functions.
- Sending pointers through channels (as compiler can’t predict goroutine receive timing).
- Pointers within slices (slice on stack, referenced data on heap).
- Arrays of slices that reallocate when capacity exceeds.
- Interface methods (runtime type and value binding).
Debugging in Go
Use these commands for memory debugging:
go tool compile -S testigGC.gogo build -gcflags="-m -m" testigGC.go
In a Nutshell
Since its inception in 2007, Google’s Go has evolved into a powerful, production-grade language powering some of the most critical cloud-native projects globally. Its simplicity, performance, and concurrency model make it ideal for scalable applications.
Understanding Go’s memory management—from allocation and heap usage to garbage collection—enables developers to write efficient, resource-optimized programs. Whether you are a beginner or a seasoned developer, mastering these concepts ensures robust, high-performance software with Go.
Have questions about Golang Memory Management?